DataFrame Injector Demo
This tutorial will walk you through:
importing the DataGen library
Generating random data
Generating frequency domain data
Generating time domain signal data
Setup and import packages
Import DataFrameInjector and other packages that are used in this tutorial
import sys
import os
import pandas as pd
import numpy as np
import matplotlib.pyplot as plt

# Add the repo root to sys.path
repo_root = os.path.abspath(os.path.join("..", "src"))
if repo_root not in sys.path:
    sys.path.insert(0, repo_root)


from fault_injector.injector import Injector
from fault_injector.df_injector import DataFrameInjector
from fault_injector.visualizer import FaultVisualizer
from fault_injector.fault_lib import *
Starting Data
Create original data frame
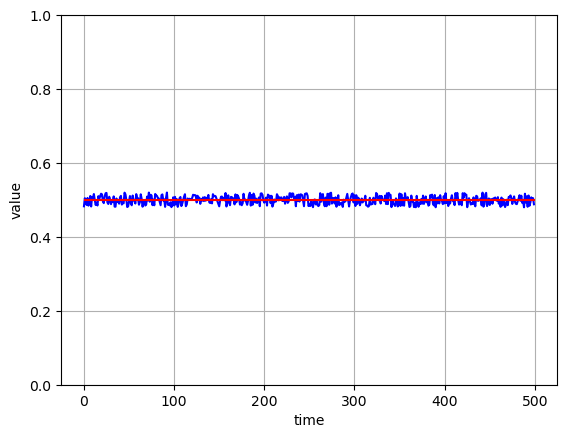
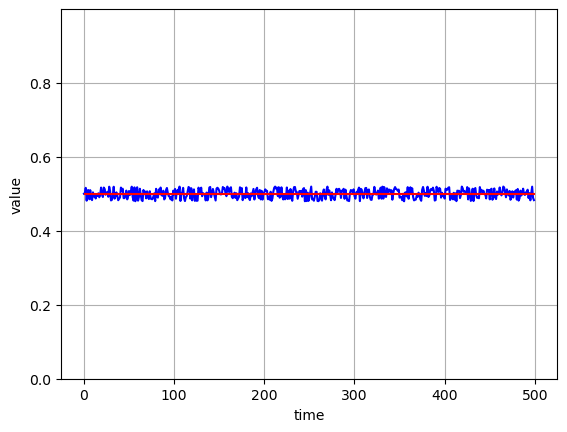
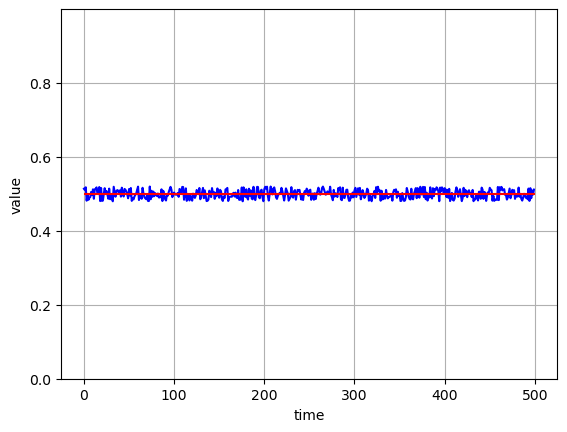
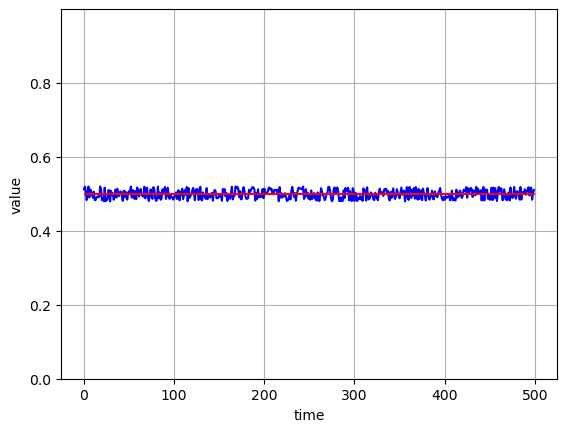
    def plot_values(values, size):
        """
        this function can be used to plot the randomly generated data. To generate this data, see `random_gen` method.
        """
        max_val = max(values)
        min_val = min(values)

        # calculate the middle of the extremes
        y_mid =  (max_val - min_val) / 2 + min_val

        # set the y_max to 2 times the mid. This center the data points on the y axis
        y_max = y_mid * 2

        fig, ax = plt.subplots()
        # plot the generated data
        ax.plot(values, color="blue")

        # plot a horizontal line across the middle
        ax.hlines(y=y_mid, xmin=0, xmax=size, color="red")

        ax.set(xlabel="time", ylabel="value")

        # ylim assumes the values are positive
        ax.set_ylim([0, y_max])
        ax.grid()

        plt.show()
rand_max = 0.52
rand_min = 0.48
size = 500

df = pd.DataFrame()
for i in ['a','b','c','d','e']:
    col_name = f'col_{i}'
    print(f'Column name: {col_name}')

    # generate synthetic data
    values = np.random.uniform(rand_min, rand_max, size)
    df[col_name] = np.array(values)
    plot_values(values, size)
Column name: col_a
Column name: col_b

Column name: col_c
Column name: col_d
Column name: col_e
Define Faults
Create two fault instances:
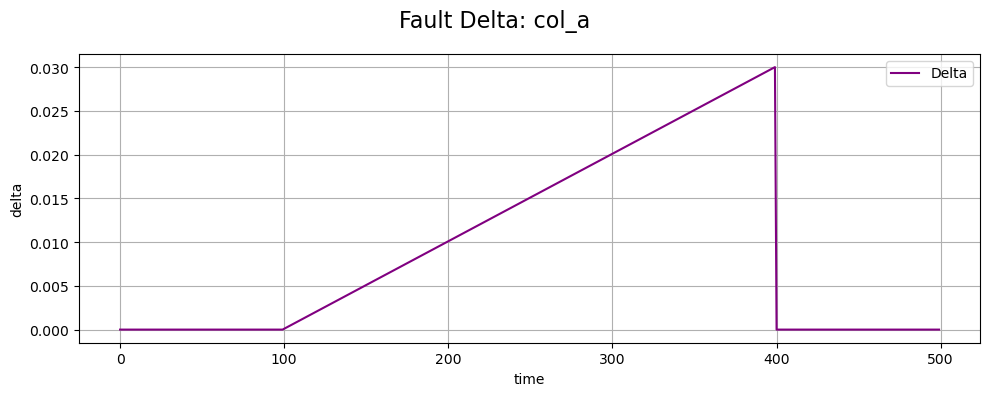
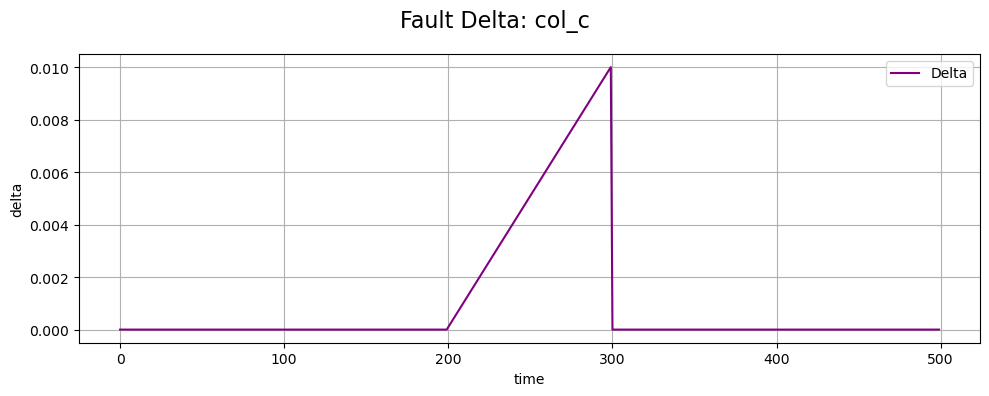
drift_fault_obj: instance of the DriftFault with a drift rate of 0.0001
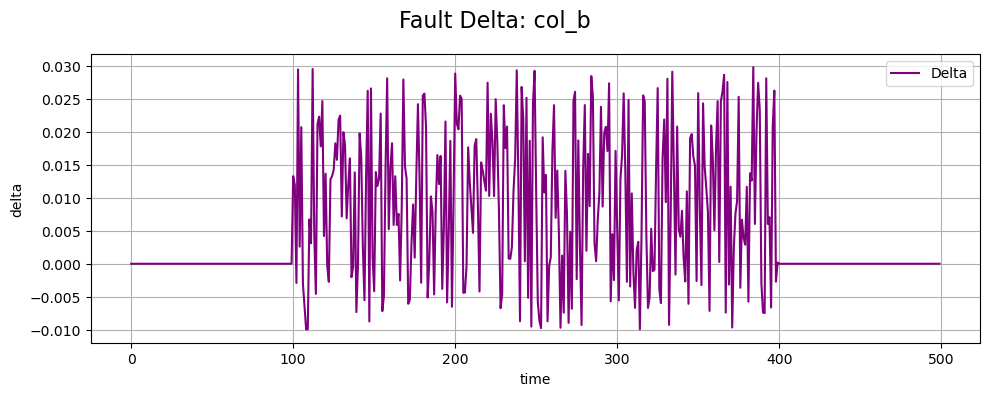
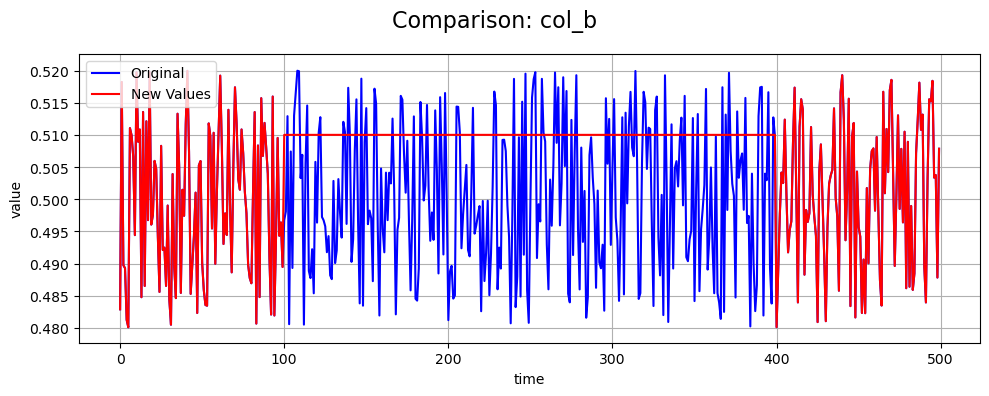
stuck_fault_obj: instance of the StuckValueFault with a stuck value of 0.51
fault_params = {"drift_rate": 0.0001}
drift_fault_obj = DriftFault(params=fault_params)

fault_params = {"stuck_val": 0.51}
stuck_fault_obj = StuckValueFault(params=fault_params)
Define Injectors
Create 3 injector instances:
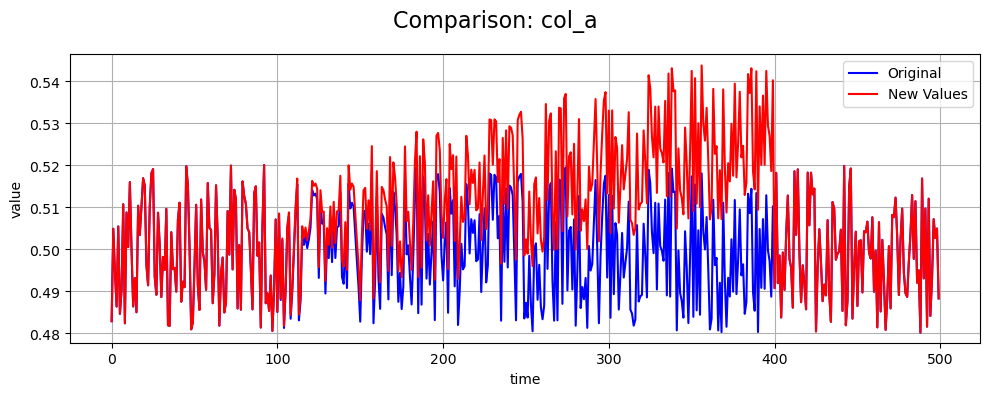
injector_object_a: injection index range is 100 to 400 and uses the drift fault
injector_object_b: injection index range is 100 to 400 and uses the stuck value fault
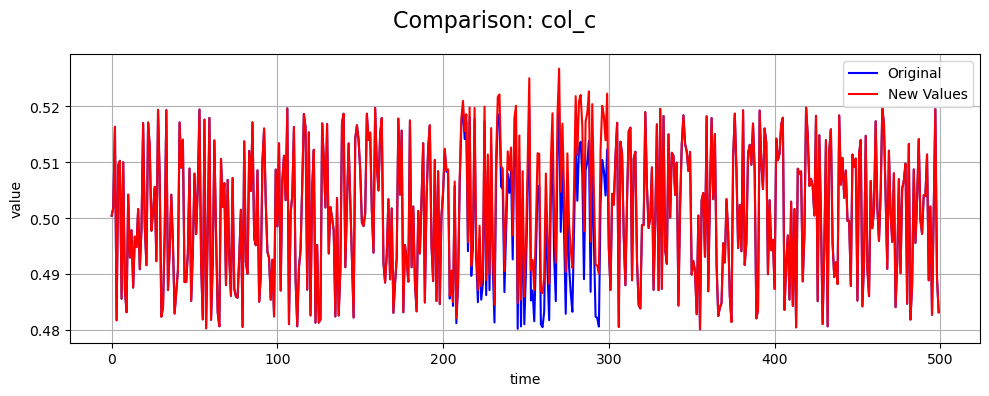
injector_object_c: injection index range is 200 to 300 and uses the drift fault
Note: col_d gets the same injector as col_c
# injector_a -> range: 100 to 400, drift fault
injector_params = {"start":100,
                   "stop": 400}
injector_object_a = Injector(fault=drift_fault_obj,
                           params=injector_params)

# injector_b -> range: 100 to 400, stuck value fault
injector_object_b = Injector(fault=stuck_fault_obj,
                           params=injector_params)

# injector_c -> range: 200 to 300, drift fault
injector_params = {"start":200,
                   "stop": 300}
injector_object_c = Injector(fault=drift_fault_obj,
                           params=injector_params)

injector_dict = {
                    "col_a": injector_object_a,
                    "col_b": injector_object_b,
                    "col_c": injector_object_c,
                    "col_d": injector_object_c,
                }

df_injector_object = DataFrameInjector(injector_dict=injector_dict)
Col_A
Fault Type: drift
Fault Range: 100:400
Injector object: a
Col_B
Fault Type: stuck value
Fault Range: 100:400
Injector object: b
Col_C
Fault Type: drift
Fault Range: 200:300
Injector object: c
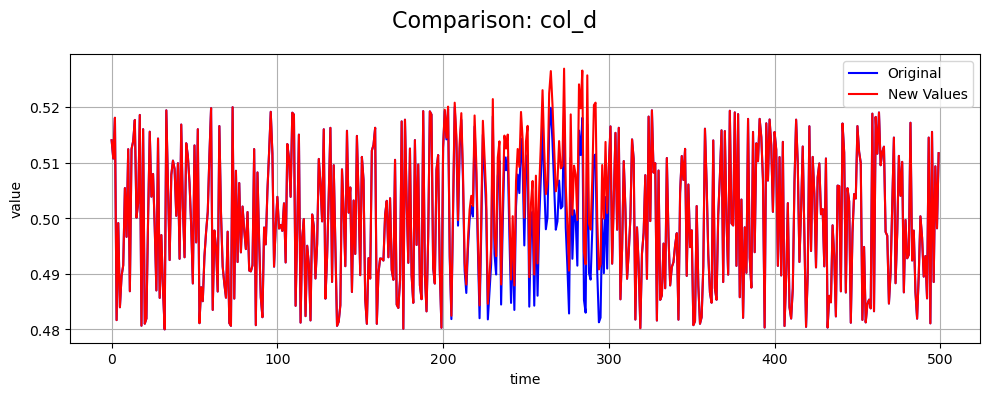
Col_D
Fault Type: drift
Fault Range: 200:300
Injector object: c
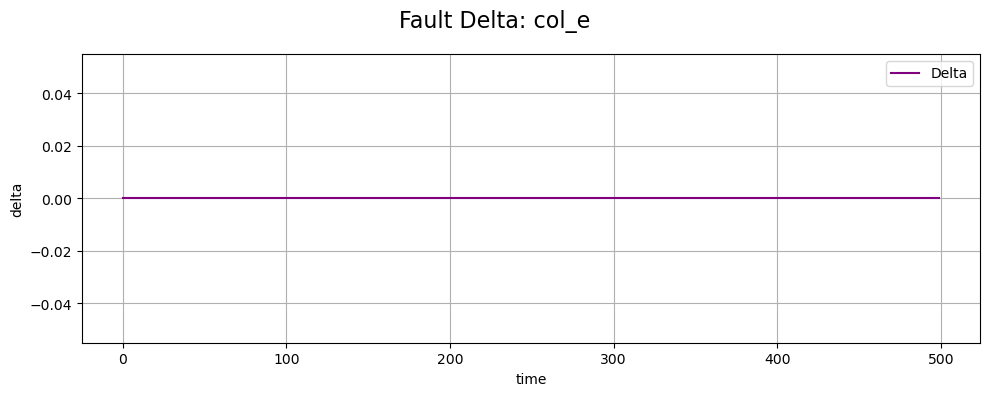
Col_E
Fault Type: None
Fault Range: None
Injector object: None
Inject Fault
Inject the values and output the new values
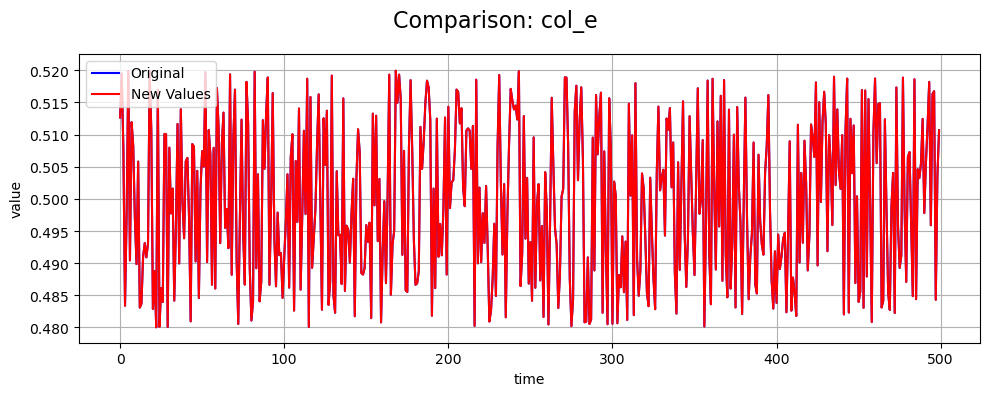
Note: col_e does not get a fault injected into it
new_values = df_injector_object.inject_faults(df=df)
Compare Original to New Values
Plot Fault Deltas
# initiate the visualizer
vis = FaultVisualizer()

vis.plot_fault_delta_df(df, new_values, title='Fault Delta')
Column name: col_a
Column name: col_b
Column name: col_c
Column name: col_d

Column name: col_e
Plot Comparison
vis.plot_comparison_df(df, new_values, title='Comparison')
Column name: col_a
Column name: col_b
Column name: col_c
Column name: col_d
Column name: col_e