NaN Fault Demo
This tutorial will walk you through:
creating a fault instance
creating an injector instance
using the injector to inject a fault into data
visualize the results
Setup and import packages
Import NaNFault and other packages that are used in this tutorial
import sys
import os

# Add the repo root to sys.path
repo_root = os.path.abspath(os.path.join("..", "src"))
if repo_root not in sys.path:
    sys.path.insert(0, repo_root)

from fault_injector.injector import Injector
from fault_injector.visualizer import FaultVisualizer
from fault_injector.fault_lib import *
import numpy as np
import matplotlib.pyplot as plt
Starting Data
Generate random generated data using the DataGen library. This data will serve as the sensor data for this experiment.
Any list or array of numeric values can replace the original_value variable in this tutorial.
    def plot_values(values, size):
        """
        this function can be used to plot the randomly generated data. To generate this data, see `random_gen` method.
        """
        max_val = max(values)
        min_val = min(values)

        # calculate the middle of the extremes
        y_mid =  (max_val - min_val) / 2 + min_val

        # set the y_max to 2 times the mid. This center the data points on the y axis
        y_max = y_mid * 2

        fig, ax = plt.subplots()
        # plot the generated data
        ax.plot(values, color="blue")

        # plot a horizontal line across the middle
        ax.hlines(y=y_mid, xmin=0, xmax=size, color="red")

        ax.set(xlabel="time", ylabel="value")

        # ylim assumes the values are positive
        ax.set_ylim([0, y_max])
        ax.grid()

        plt.show()
rand_max = 0.52
rand_min = 0.48
size = 500
# generate synthetic data
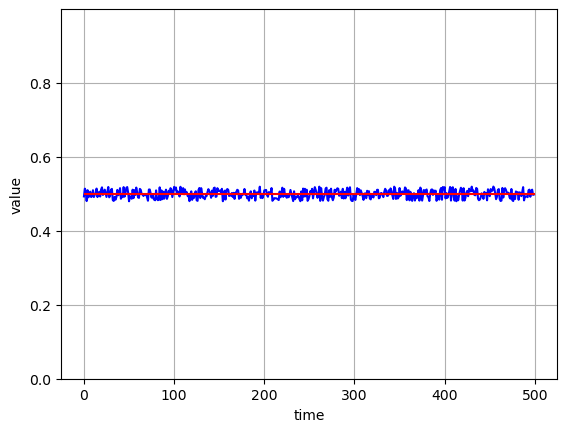
original_values = np.random.uniform(rand_min, rand_max, size)
plot_values(original_values, size)
Generated Data
Define Fault
This example will utilize the NaNFault library to create an instance of the nan fault.
fault_obj = NaNFault()
Define Injector
The Injector library will be used for the injector instance. This instance take in fault and params.
fault expects a fault object, just like the one created in the previous step.
params expects a dictionary with two keys: start and stop. These keys correspond to the starting and ending indices for the list/array of numeric values that will receive the fault. In this example, the indices that receive the fault range from 100 to 400.
injector_params = {"start":100,
                   "stop": 400}
injector_object = Injector(fault=fault_obj,
                           params=injector_params)
Inject Fault
Use the inject_fault method of the Injector object to inject the fault. This method expects the x variable to be set equal to a list or array of numeric values. This represents the true values prior to receiving a fault. For this example, the original_values variable that was generated earlier will be used.
new_values = injector_object.inject_fault(x=original_values)
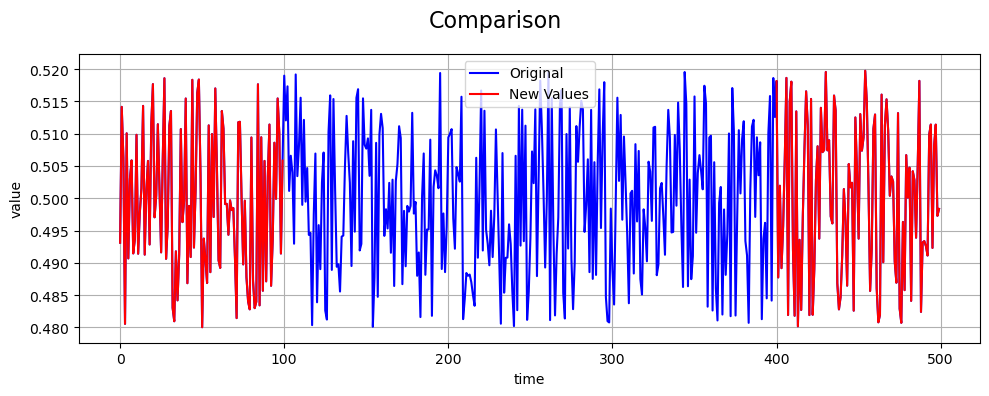
Compare Original to New Values
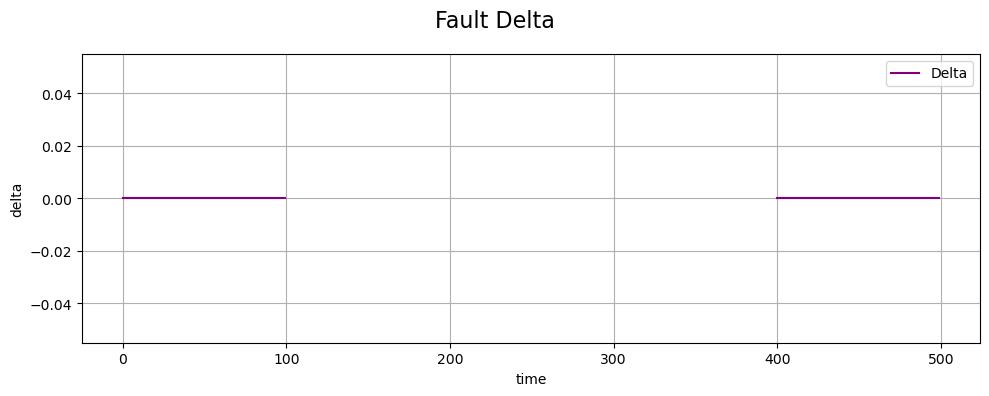
To visualize the fault, we will examine the Fault delta, then plot the new values compared to the true values.
# initiate the visualizer
vis = FaultVisualizer()

vis.plot_fault_delta(original_values, new_values, title='Fault Delta')
Fault Delta
vis.plot_comparison(original_values, new_values, title='Comparison')
Fault Comparison